Introduction
When it comes to trading, understanding support and resistance levels can be a game-changer. These levels help traders make informed decisions by identifying key points where the price is likely to react. Let’s dive into what support and resistance levels are and how you can use them to improve your trades.
Understanding Support Levels

What is a Support Level?
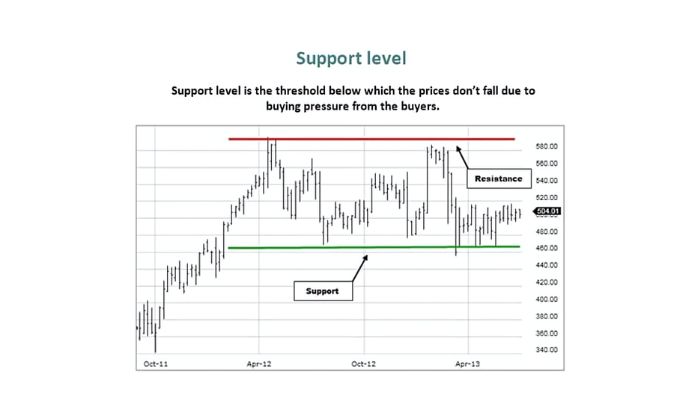
Support levels are like the safety nets in the market. They represent price points where an asset tends to find buying interest, preventing the price from falling further. Think of them as the floors that support your trades.
Identifying Support Levels on a Chart
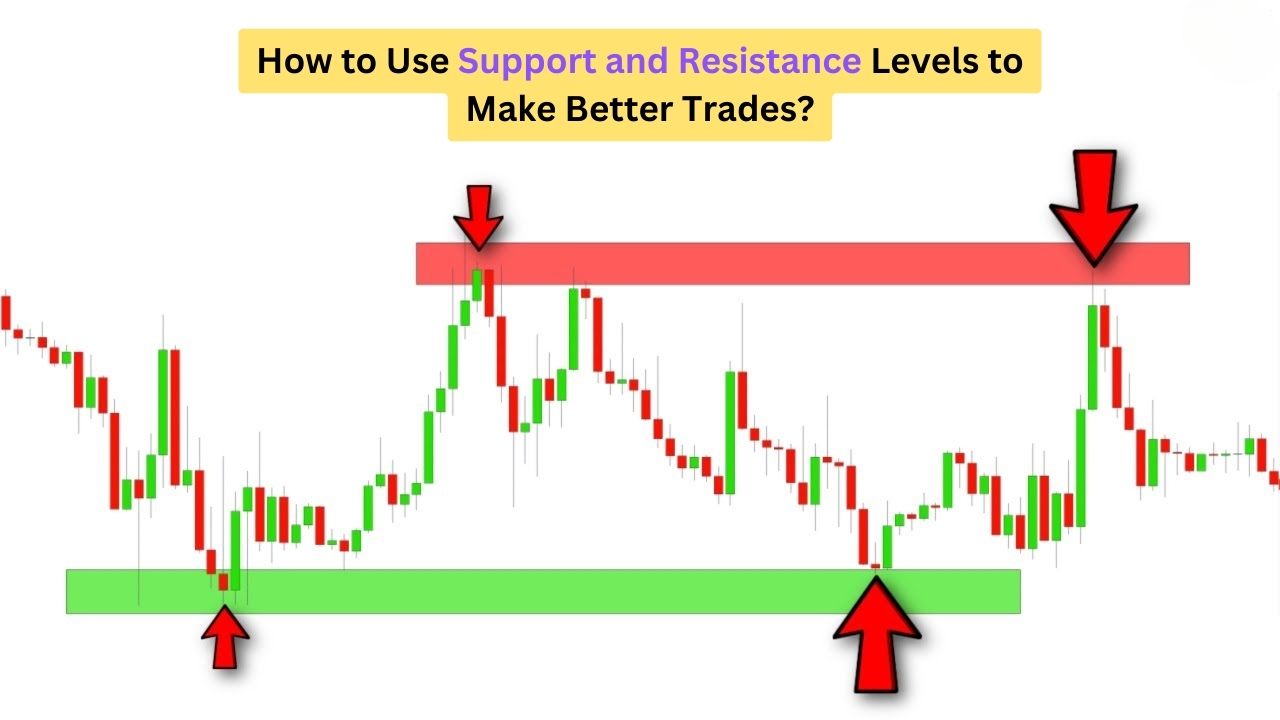
To spot a support level, look for areas on the chart where the price repeatedly stops falling and starts to rise. These are often historical lows or areas where buyers previously stepped in.
Understanding Resistance Levels

What is a Resistance Level?
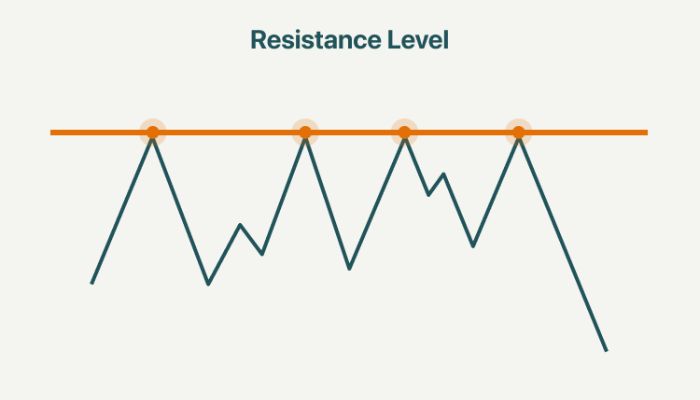
Resistance levels are the ceilings of the market. They are price points where selling interest is strong enough to prevent the price from rising further. Just as support levels hold prices up, resistance levels cap them.
Identifying Resistance Levels on a Chart
To identify resistance levels, look for areas where the price repeatedly rises to a certain point and then falls back. These are often previous highs or areas where sellers previously took action.
The Psychology Behind Support and Resistance
Why These Levels Work?
Support and resistance levels work because they reflect human psychology. When prices hit a support level, buyers perceive it as a bargain, while resistance levels are seen as too expensive.
Market Sentiment and Price Action
Market sentiment drives price action around these levels. If traders believe a support level will hold, they’ll buy, creating a self-fulfilling prophecy. The same goes for resistance levels where sellers step in.
Also Read: How to Pick US Shares That Guarantee High Returns?
Using Support and Resistance in Different Markets
Stocks
In the stock market, support and resistance levels can help identify entry and exit points. For instance, if a stock repeatedly bounces off a support level, it might be a good buying opportunity.
Forex
In Forex trading, these levels are crucial due to high market volatility. Traders use support and resistance to set stop-loss and take-profit orders.
Cryptocurrencies
Crypto markets are notoriously volatile. Support and resistance levels can help traders navigate this volatility by identifying key price points to watch.
How to Draw Support and Resistance Lines?

Tools and Techniques
Drawing these lines involves identifying key price points and connecting them. Tools like trendlines, horizontal lines, and even advanced charting software can help.
Common Mistakes to Avoid
Avoid forcing lines to fit your expectations. The market doesn’t always adhere to precise lines, so be flexible and look for zones instead of exact points.
Combining Support and Resistance with Other Indicators
Moving Averages
Moving averages can help confirm support and resistance levels. For instance, if a support level coincides with a moving average, it’s likely stronger.
RSI (Relative Strength Index)
RSI can indicate whether an asset is overbought or oversold, providing additional context to support and resistance levels.
Trading Strategies Involving Support and Resistance
Bouncing Strategy
This strategy involves buying at support and selling at resistance. It’s straightforward but requires patience and discipline.
Breakout Strategy
Here, traders wait for the price to break through support or resistance and then trade in the direction of the breakout. This can be risky but offers high rewards.
Also Read: How to Beat the Stock Market with AI-Powered Trading Tools in 2024?
Setting Stop-Loss and Take-Profit Levels
Importance of Risk Management
Risk management is crucial in trading. Setting stop-loss and take-profit levels around support and resistance can help protect your capital and lock in profits.
Practical Tips
Always set your stop-loss slightly below support and take-profit just below resistance to account for market fluctuations.
Common Pitfalls to Avoid
Over-reliance on Support and Resistance
While these levels are helpful, don’t rely on them exclusively. Combine them with other indicators and market analysis.
Ignoring Market Conditions
Always consider the broader market context. Economic news, earnings reports, and geopolitical events can impact price movements beyond support and resistance.
Real-Life Examples of Successful Trades
Case Study 1: Stock Market
Consider a stock that consistently bounced off a support level around $50. Traders who bought at this level and sold at the $60 resistance made consistent profits.
Case Study 2: Forex Market
In the Forex market, a currency pair might repeatedly hit resistance at 1.2000. Traders who shorted at this level and set take-profits around 1.1900 capitalized on this pattern.
Advanced Techniques and Tips
Trend Lines and Channels
Trend lines and channels can provide additional support and resistance levels. These dynamic levels adjust with the trend, offering more trading opportunities.
Fibonacci Retracements
Fibonacci retracements can help identify potential support and resistance levels based on mathematical ratios. These levels often coincide with significant price points.
Tools and Resources for Traders
Trading Platforms
Platforms like MetaTrader and TradingView offer advanced tools for drawing support and resistance lines, along with other indicators.
Educational Resources
Websites like Investopedia and BabyPips offer comprehensive guides and courses on using support and resistance in trading.
Continuous Learning and Adaptation
Keeping Up with Market Trends
Markets are always changing, so continuous learning is essential. Stay updated with the latest trends and strategies.
Learning from Mistakes
Every trader makes mistakes. The key is to learn from them and adapt your strategies accordingly.
Also Read: How to Make $1000 a Day Trading Stocks?
Conclusion
Support and resistance levels are fundamental tools for traders. By understanding and using these levels effectively, you can make better trading decisions and improve your overall performance. Remember to combine them with other indicators, practice good risk management, and stay informed about market conditions. Happy trading!
FAQs
What are support and resistance levels?
Support levels are price points where an asset tends to find buying interest, preventing the price from falling further. Resistance levels are price points where selling interest is strong enough to prevent the price from rising further.
How do I draw support and resistance lines?
Identify key price points where the price repeatedly stops falling (support) or rising (resistance) and connect them using tools like trendlines or horizontal lines on your chart.
Can I rely solely on support and resistance for trading?
No, while support and resistance are helpful, it’s important to combine them with other indicators and consider the broader market context.
What are some common mistakes to avoid with support and resistance?
Avoid forcing lines to fit your expectations, over-relying on these levels without other analysis, and ignoring broader market conditions.
How can I improve my trading skills using support and resistance?
Practice identifying these levels, combine them with other indicators, continuously learn and adapt, and review successful trades for insights.
Hello guys! My name is David Wilson, and I'm a passionate stock market enthusiast and the founder of 9to5Stock. With a deep understanding of market dynamics and a commitment to empowering others, I share valuable insights, strategies, and updates to help investors like you make informed decisions and achieve financial success. Welcome to our community, and let's thrive together in the world of investing!
