Introduction
Predicting stock market trends can seem like a daunting task, especially for beginners. However, with the right knowledge and tools, you can make informed decisions and navigate the stock market like a pro. This guide will help you understand the basics of stock market analysis, the key indicators to watch, and how to develop a successful trading strategy tailored for the Indian market.
Understanding the Stock Market

What is the Stock Market?
The stock market is where investors buy and sell shares of publicly traded companies. It’s a critical part of the economy, providing companies with capital to grow and investors with a chance to earn returns on their investments.
Importance of Predicting Trends
Predicting stock market trends is crucial because it helps investors make informed decisions. By anticipating market movements, you can buy low, sell high, and maximize your profits. Moreover, understanding trends can help you avoid potential losses during market downturns.
Basic Concepts in Stock Market Analysis

Fundamental Analysis
Fundamental analysis involves evaluating a company’s financial health, including its revenue, earnings, future growth potential, and market position. This method helps investors determine the intrinsic value of a stock and whether it is overvalued or undervalued.
Technical Analysis
Technical analysis focuses on historical price and volume data to predict future market trends. By studying charts and using various indicators, traders can identify patterns and make predictions about future price movements.
Key Indicators for Stock Market Trends

Moving Averages
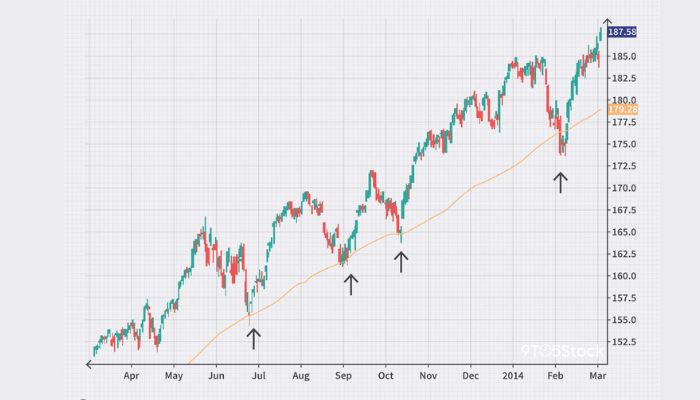
Moving averages smooth out price data to identify the direction of a trend. The two most common types are the simple moving average (SMA) and the exponential moving average (EMA). These averages help traders spot trend reversals and continuations.
Relative Strength Index (RSI)
RSI measures the speed and change of price movements on a scale of 0 to 100. A stock is considered overbought when the RSI is above 70 and oversold when it is below 30. This indicator helps traders identify potential reversal points.
Moving Average Convergence Divergence (MACD)
MACD is a trend-following momentum indicator that shows the relationship between two moving averages of a stock’s price. It consists of the MACD line and the signal line, which can help traders identify buy and sell signals.
Bollinger Bands
Bollinger Bands consist of a middle band (SMA) and two outer bands. These bands expand and contract based on market volatility. When prices touch the upper band, the stock is considered overbought, and when they touch the lower band, it is considered oversold.
External Factors Influencing Stock Market Trends

Economic Indicators
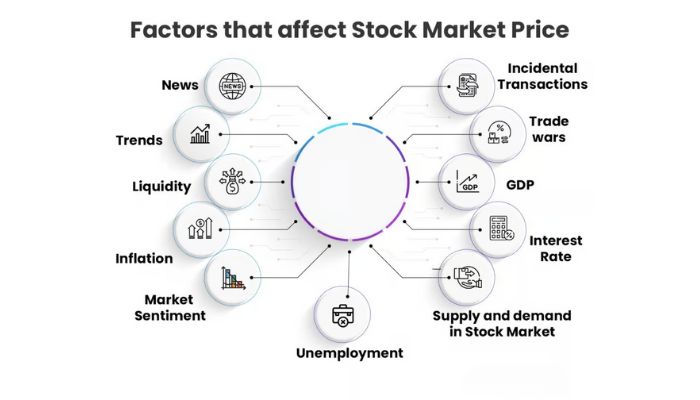
Economic indicators such as GDP growth, inflation rates, and employment data can significantly impact stock market trends. Positive economic data often leads to bullish markets, while negative data can result in bearish trends.
Political Events
Political events, including elections, policy changes, and geopolitical tensions, can cause market volatility. Investors need to stay informed about political developments to predict their potential impact on the market.
Global Markets Impact
The Indian stock market is influenced by global markets. Events such as changes in US interest rates, global economic trends, and international trade policies can affect investor sentiment and market movements in India.
Mus Read: Stock Market Trends 2024: What Every Investor Needs to Know
Tools and Resources for Predicting Trends

Stock Market Software
Various software tools provide real-time data, charts, and indicators to help traders analyze market trends. Popular options include MetaTrader, TradingView, and Zerodha Kite.
Financial News Outlets
Staying updated with financial news is crucial for predicting market trends. Websites like Bloomberg, CNBC, and Economic Times offer valuable insights and analysis.
Online Forums and Communities
Online forums and communities such as Reddit, Quora, and StockTwits are excellent places to discuss market trends, share insights, and learn from experienced traders.
Developing a Trading Strategy

Setting Clear Goals
Before you start trading, define your financial goals. Are you looking for short-term gains or long-term investments? Having clear objectives will guide your trading decisions.
Risk Management Techniques
Effective risk management is crucial to protecting your investments. Techniques include setting stop-loss orders, diversifying your portfolio, and not investing more than you can afford to lose.
Continuous Learning and Adaptation
The stock market is constantly evolving, so continuous learning is essential. Attend webinars, read books, and follow market experts to stay updated with the latest trends and strategies.
Case Studies of Successful Predictions

Historical Trends Analysis
Studying past market trends can provide valuable insights. For instance, the analysis of the 2008 financial crisis and the subsequent recovery offers lessons on market behavior during extreme conditions.
Lessons from Market Experts
Learning from successful investors like Warren Buffett and Rakesh Jhunjhunwala can provide practical strategies and insights into predicting market trends. Their approaches to fundamental and technical analysis are time-tested and effective.
Conclusion
Predicting stock market trends in India requires a combination of fundamental and technical analysis, staying informed about external factors, and using the right tools. By developing a solid trading strategy and continuously learning, you can make informed decisions and navigate the stock market like a pro. Remember, the key to successful trading is not just predicting trends but also managing risks effectively.
May You Like:
- 10 Surprising Stock Market Tips Every Investor Needs to Know!
- Beginner’s Guide to Investing in the Stock Market: Tips and Strategies
FAQs
Q1: What is the best method for predicting stock market trends?
A: Both fundamental and technical analysis are essential. Combining these methods provides a comprehensive view of the market, helping you make more accurate predictions.
Q2: How often should I review my trading strategy?
A: Regularly reviewing your strategy, at least quarterly, ensures it remains effective and aligned with current market conditions.
Q3: Can political events really impact the stock market that much?
A: Yes, political events can cause significant market volatility. Policy changes, elections, and geopolitical tensions can all influence investor sentiment and market movements.
Q4: Are there any free tools for technical analysis?
A: Yes, platforms like TradingView offer free versions with extensive charting tools and indicators suitable for technical analysis.
Q5: How important is risk management in stock trading?
A: Risk management is crucial. It helps protect your investments from significant losses and ensures long-term success in trading.
Disclaimer: The information provided in this blog is for educational and informational purposes only. It should not be considered as financial advice. The content is based on the author’s personal knowledge and experience, and while every effort is made to ensure the accuracy of the information, errors and omissions can occur. The stock market involves significant risks, and investing in the stock market can result in substantial financial losses. Readers are advised to conduct their own research and consult with a licensed financial advisor before making any investment decisions. The author and the website are not responsible for any financial losses or damages incurred as a result of using the information provided in this blog.
Hello guys! My name is David Wilson, and I'm a passionate stock market enthusiast and the founder of 9to5Stock. With a deep understanding of market dynamics and a commitment to empowering others, I share valuable insights, strategies, and updates to help investors like you make informed decisions and achieve financial success. Welcome to our community, and let's thrive together in the world of investing!
