
Technical analysis is a method used by traders to evaluate securities and make trading decisions by analyzing statistical trends from trading activity, such as price movement and volume. This approach relies heavily on historical data and chart patterns to forecast future market behavior. For both novice and experienced traders, mastering technical analysis can be a key to achieving better trading decisions.
Introduction to Technical Analysis
Technical analysis involves analyzing past market data, primarily price and volume, to forecast future price movements. Unlike fundamental analysis, which evaluates a company’s financial and economic factors, technical analysis focuses solely on market-generated data. This distinction makes it a crucial tool for traders looking to capitalize on short-term price movements.
The core premise of technical analysis is that all known information is already reflected in the asset’s price. Therefore, studying price charts and patterns can provide insights into future price movements. The method is widely used across various markets, including stocks, commodities, forex, and cryptocurrencies. Understanding how to interpret charts and indicators can be pivotal in making more informed trading decisions.
Key Concepts in Technical Analysis
Support and Resistance Levels
Support and resistance are fundamental concepts in technical analysis. Support refers to a price level where a downtrend can be expected to pause due to a concentration of demand. Conversely, resistance is a price level where an uptrend can pause due to a concentration of supply. Identifying these levels can help traders make decisions about entering or exiting trades.
Support and resistance levels are not always exact; they can vary slightly, forming zones rather than precise lines. Traders often use previous highs and lows, moving averages, or Fibonacci retracement levels to determine these zones. The psychology behind these levels is rooted in market sentiment—buyers are more likely to purchase at support levels, while sellers are more inclined to sell at resistance levels.
Trend Lines
Trend lines are a cornerstone of technical analysis. They are drawn on charts to connect significant price points, thereby indicating the general direction of the market. Uptrend lines connect a series of ascending lows, while downtrend lines connect a series of descending highs. These lines help traders identify market trends, making it easier to decide when to enter or exit a trade.
The strength of a trend line is determined by the number of times the price has touched it. A trend line that the price touches frequently without breaking is considered strong and reliable. However, no trend lasts forever; traders must watch for trend reversals, which can signal a change in market direction.
Also Read: Day Trading vs Swing Trading: Which Style Suits You?
Popular Technical Indicators
Moving Averages
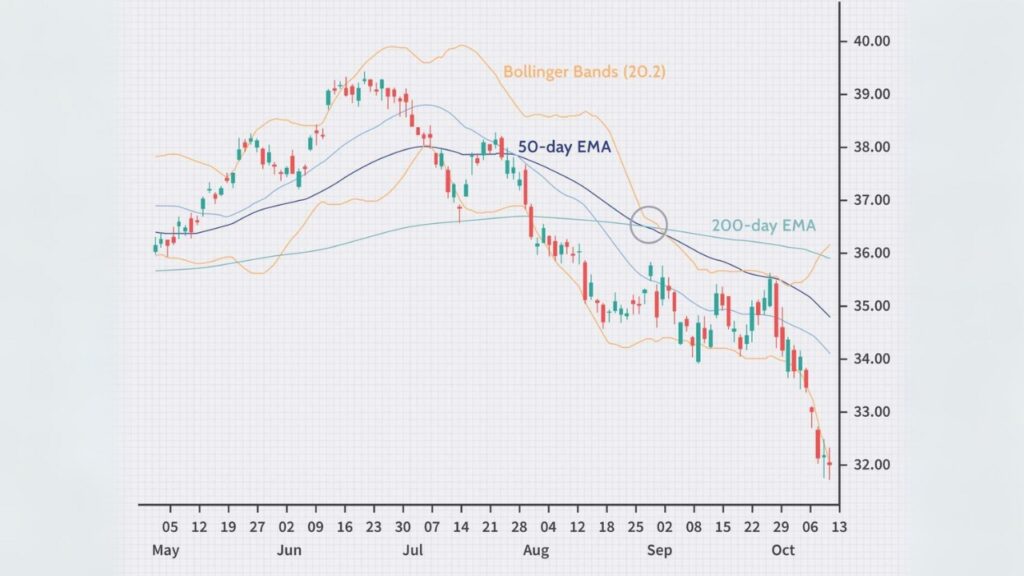
Moving averages are among the most widely used indicators in technical analysis. They smooth out price data to identify the direction of a trend. The two most common types are the Simple Moving Average (SMA) and the Exponential Moving Average (EMA). The SMA calculates the average price over a specified period, while the EMA gives more weight to recent prices, making it more responsive to new information.
Traders often use moving averages to identify support and resistance levels. For example, if the price of an asset is above its 200-day SMA, it is generally considered to be in an uptrend. Crossovers, where a shorter-term moving average crosses above or below a longer-term moving average, are also significant. A bullish crossover occurs when a short-term average crosses above a long-term average, signaling a potential uptrend. Conversely, a bearish crossover suggests a downtrend.
Relative Strength Index (RSI)
The Relative Strength Index (RSI) is a momentum oscillator that measures the speed and change of price movements. It ranges from 0 to 100, with values above 70 typically indicating overbought conditions and values below 30 indicating oversold conditions. The RSI is valuable for identifying potential reversal points, as extreme RSI values often precede reversals in price.
Traders use the RSI in conjunction with other indicators to confirm signals. For instance, if an asset is in a downtrend and the RSI falls below 30, this could indicate a potential buying opportunity. However, it is crucial to consider the broader market context, as RSI can sometimes remain overbought or oversold for extended periods.
Moving Average Convergence Divergence (MACD)
The Moving Average Convergence Divergence (MACD) is a trend-following momentum indicator that shows the relationship between two moving averages of a security’s price. The MACD is calculated by subtracting the 26-period EMA from the 12-period EMA. The result is the MACD line, which is plotted against the signal line, a 9-day EMA of the MACD line.
The MACD is particularly useful for identifying changes in the strength, direction, momentum, and duration of a trend. A bullish signal occurs when the MACD line crosses above the signal line, while a bearish signal is indicated when the MACD line crosses below the signal line. Divergence between the MACD and the asset’s price can also indicate potential trend reversals.
Also Read: The Future of Cryptocurrency: Trends and Predictions in 2024
Chart Patterns and Their Implications

Head and Shoulders Pattern
The Head and Shoulders pattern is one of the most reliable chart patterns in technical analysis. It consists of three peaks: the highest in the middle (the head) and two lower peaks on either side (the shoulders). This pattern typically indicates a reversal from an uptrend to a downtrend.
The pattern is confirmed when the price breaks below the neckline, which is drawn by connecting the lows of the two troughs. Traders often use this point as a signal to enter a short position. The opposite pattern, known as the Inverse Head and Shoulders, indicates a potential reversal from a downtrend to an uptrend.
Double Top and Double Bottom
The Double Top and Double Bottom patterns are also common reversal patterns. A Double Top occurs when the price reaches a high point twice, with a moderate decline in between, signaling a potential reversal from a bullish to a bearish trend. Conversely, a Double Bottom forms when the price reaches a low point twice, indicating a potential reversal from a bearish to a bullish trend.
The confirmation of these patterns usually comes when the price breaks through the neckline, the level at which the price hit its lowest point between the two peaks (or highest point between two troughs). Traders often use these breakouts as entry points for new trades.
Combining Indicators for Comprehensive Analysis
No single indicator can provide all the information needed to make a trading decision. Therefore, traders often combine multiple indicators to get a more comprehensive view of the market. For instance, combining moving averages with the RSI and MACD can provide insights into trend direction, momentum, and potential reversal points.
When combining indicators, it’s crucial to avoid information overload. Too many indicators can lead to conflicting signals and confusion. Instead, traders should select a few key indicators that complement each other. For example, using the RSI for momentum and the MACD for trend confirmation can be a balanced approach.
Risk Management in Technical Trading
Risk management is a critical component of successful trading. Even the best analysis can result in losses if risk is not properly managed. Traders should set stop-loss orders to limit potential losses on a trade. A stop-loss order automatically closes a position when the price reaches a predetermined level.
Position sizing is another important aspect of risk management. Traders should never risk more than a small percentage of their capital on a single trade. The general rule of thumb is to risk no more than 1-2% of your total capital on any single trade. This approach helps protect the trading account from significant losses.
Common Mistakes to Avoid in Technical Analysis
While technical analysis can be a powerful tool, it’s not without its pitfalls. One common mistake is overtrading—making too many trades in an attempt to capture every price movement. This approach can lead to increased costs and reduced overall profitability. It’s crucial to have a well-defined trading plan and stick to it.
Another common mistake is ignoring the broader market context. Technical analysis should not be used in isolation; fundamental factors and broader market trends can significantly impact the effectiveness of technical signals. Finally, traders should avoid confirmation bias, where they only consider information that supports their existing beliefs or positions.
Also Read: How to Identify Stock Market Bubbles Before They Burst!
How to Develop a Technical Trading Plan?
Developing a solid trading plan is essential for consistent success in trading. A good plan includes clear criteria for entering and exiting trades, risk management strategies,
and rules for monitoring trades. It’s crucial to backtest your trading plan on historical data to ensure its effectiveness before applying it in real-time trading.
The plan should also be flexible enough to adapt to changing market conditions. Regularly reviewing and updating the trading plan can help traders stay aligned with their trading goals and the evolving market landscape. Additionally, keeping a trading journal can be invaluable for tracking performance and learning from past trades.
Real-World Examples of Technical Analysis in Action
Technical analysis is widely used by professional traders and investors. For example, many hedge funds employ complex algorithms that incorporate technical indicators to execute high-frequency trades. Retail traders also use technical analysis to identify trading opportunities in various markets, including stocks, forex, and cryptocurrencies.
A notable example is the use of technical analysis in the cryptocurrency market. Due to the market’s high volatility, technical indicators like moving averages and RSI are particularly useful for identifying entry and exit points. Successful traders often combine these indicators with fundamental analysis to navigate the rapidly changing market landscape.
Must Read: How to Invest in the Stock Market Without Losing Sleep!
FAQ on Technical Analysis and Trading Decisions
What is technical analysis in trading?
Technical analysis is a method used to evaluate and forecast the price movements of securities based on historical market data, primarily price and volume.
How do support and resistance levels work?
Support levels indicate a price point where an asset tends to stop falling due to increased buying interest, while resistance levels are points where selling interest tends to prevent the price from rising further.
What are moving averages?
Moving averages are indicators that smooth out price data to identify the direction of a trend. They can be simple or exponential, with the latter giving more weight to recent prices.
How can RSI help in trading?
The Relative Strength Index (RSI) measures the speed and change of price movements, helping traders identify overbought or oversold conditions, which can signal potential reversals.
What is the significance of the MACD indicator?
The Moving Average Convergence Divergence (MACD) is a momentum indicator that shows the relationship between two moving averages, helping traders identify changes in trend direction.
Why is risk management important in trading?
Risk management helps traders protect their capital by limiting potential losses through strategies like stop-loss orders and proper position sizing.
Can technical analysis be used for all types of markets?
Yes, technical analysis can be applied to various markets, including stocks, forex, commodities, and cryptocurrencies.
Disclaimer: The information provided in this article is for educational and informational purposes only and should not be construed as financial advice. Trading and investing involve significant risk and can result in the loss of capital. Always conduct your own research and consult with a financial advisor or other professional before making any trading or investment decisions.
The strategies, tools, and techniques discussed in this article are based on technical analysis and market patterns. While these methods can be effective, they are not foolproof and do not guarantee future performance. Market conditions can change rapidly, and past performance is not indicative of future results.
The author and publisher of this article are not liable for any losses or damages that may arise from the use of the information provided. It is crucial to exercise caution and manage risk when participating in financial markets.
Hello guys! My name is David Wilson, and I'm a passionate stock market enthusiast and the founder of 9to5Stock. With a deep understanding of market dynamics and a commitment to empowering others, I share valuable insights, strategies, and updates to help investors like you make informed decisions and achieve financial success. Welcome to our community, and let's thrive together in the world of investing!